Bear in mind that I have described here new capabilities that are the most relevant to me. Addition to these described in here, there are so much more.
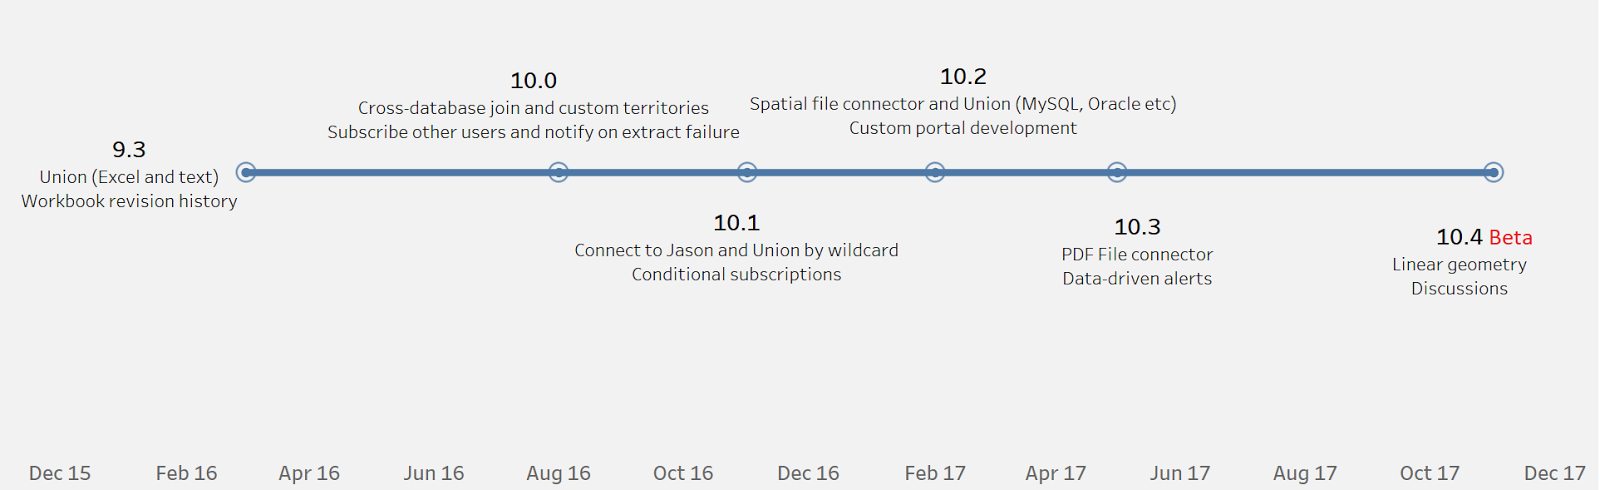
TABLEAU FROM 9.3 (March 2016) to 10.3 (September 2017)
Tableau Releases
Click on picture to un blur :)
Hallelujah, the first thing I noticed, when you have a computer with high resolution, then now Tableau all tabs and text are shown, awesome.
| Tableau Version | Tableau Desktop | Table Server/Web/Mobile |
|---|---|---|
9.3
|
New Publish Data Source flow - easier to publish, keep your data fresh (update workbook with published data source). Union - Combine multiple files or tables into a single Tableau data source (excel or text). Create groups and bins in the data grid, where you can see the data. Include parameters in an initial SQL statement for a data source. This enables like row-level security, where users can only see the data they are authorized to see. Performance - When viewing a published workbook, Tableau connects only to the data sources that are required to display your view instead of connecting to all data sources in the workbook. Postal codes for 39 European countries (including Estonia). Separate your totals, subtotals and grand totals by excluding them from color-encoding. Sheet colors. Progressive Dashboard Load- Not having to wait for the entire dashboard to load means you can start analyzing your data sooner. | Content discovery. Content analytics - find popular workbooks and views by seeing how many views they have received. Workbook revision history.Project leaders can now change owners, run refresh schedules, and move content. Low Disk-Space Monitoring- now you specify disk-space thresholds that alert you when space runs low. |
10.0
|
Clustering- Quickly spot patterns and group your data with drag-and-drop cluster analysis. Custom territories. Cross data source filters. Highlighter - Discover specific data in context. New bar charts. Use Groups in LOD expressions and calculations. Cross-database join - join data from different data sources, like SQL Server and Oracle. Google Sheets connector. Oracle stored procedures as a data source. Enjoy a clean, beautiful canvas for analytics, with new iconography, typography, and colors. Workbook defaults. | Kerberos support. Notify on extract failure. Tableau Online Sync client now emails data source owners if a refresh fails. Tableau Mobile on your Android phone or tablet. Add published data sources and author dashboards right in your browser. Data source analytics - see what’s hot in your organization with baked-in analytics on data sources. View usage stats at a glance and favorite the ones you use the most. Quickly roll back to an older version with workbook and data source revision history. Subscribe other users. Desktop licensing views. Using the Web Data Connector, refresh an external ETL job from Tableau while remaining in the flow of your analysis. |
10.1
|
Connect to JSON data and Marketo. Union by wildcard and Union Google Sheets. Drill-up on continuous date fields | Conditional Subscription (also possibility not to send if empty). Automated installation of Tableau Server. Web authoring keeps on getting better - you can easily edit reference lines and bands, and use interactions like show/hide headers. Full screen viz. |
| 10.2 | Spatial file connector- Connect to ESRI Shapefiles, KML, GeoJSON, and MapInfo file types. Run predictive models in Tableau with Python integration. Understand the relationship between measures in your viz with covariance and correlation, new functions in the Tableau calculation language. Table calc assistance. Union tables from a SQL Server, MySQL, Oracle, Postgres, Redshift, or HP Vertica database. Automatic data parse -Transform your data from a string to a date type, no calculations required. Create custom joins through calculations. SharePoint Lists connector. Export data to CSV. Autosave. | Web authoring improvements - a new top level menu with added analytical functionality, update colors and borders on your data, edit reference line distributions, and configure more dashboard options all from your browser. File version number. Jumpstart your custom portal development with our code sample. Use our example to embed Tableau content in your own web pages and quickly build external controls for embedded dashboards. Site to site migration code sample. |
10.3
|
PDF File connector. Union tables from a .pdf file as well as Aster Database, Cloudera Hadoop, Hortonworks Hadoop, IBM DB2, IBM PDA (Netezza), Pivotal Greenplum Database, SAP Sybase ASE, SAP Sybase IQ, and Teradata.Recommended tables and joins. Tooltip selection - Select categories in your tooltips to easily identify related marks in the view. Latest date presets. Distribute evenly in dashboard. Apply table Calc filters to totals | Data-driven alerts. Web authoring updates - create Story Points and publish embedded data sources directly from the browser. You can drill up on continuous axes, change display options for maps, format numbers more easily, and create bins. Custom subscription schedules for Tableau Online. Automatic query caching after extract refreshes - Enjoy faster load times for workbooks that connect to extracts on Tableau Server. Tableau can automatically pre-cache queries for all views in a workbook, directly after an extract refresh, for faster performance on initial user load. |
10.4 (beta)
|
Use deployed MATLAB models in Tableau for predictive insights, or pre-process your data using MATLAB and persist into a Tableau data extract for further analysis. Linear geometry shapefiles - Easily visualize networks including roads and transportation routes. Data source certification - Bring a new level of governance to your analytics. Mark data sources as certified, so everyone knows they are connecting to the right data. | Web authoring improvements - you can now edit text objects, axes, filters, aliases, groups, lines, and headers with new dialogues. Discussions - Bring a new level of collaboration with real-time conversations around your data. Publish to older versions of Tableau Server. |