Kuvatud on postitused sildiga Tableau. Kuva kõik postitused

Tableau 9 Beta ülevaade (1 osa)

Väike ülevaade Tableau 9 Beta versiooni uutest võimalustest.

Avaneb uus Tableau, juba esimene pilt on veidi erinev, kuid mugavam. Nüüd lihtsamalt eristatav - 3 paneeli Data-Open-Discover

Andmeallikad


Uus võimalus Connect to ->Stats files. Ehk siis ühenduda SAS,SPSS,R andmetega otse :)

Kui sul on veerg, milles näiteks kolm väärtust korraga, siis saan nad üksteisest kohe eraldada (Split)


Kui mul on andmestikus alguses lõpus nn pealkirjad ja muu info, siis on nüüd olemas Data Interpreter ja sellel klõpsates eemaldatakse need ebavajalikud read. Eriti mugav, kui aluseks näiteks raport, mis genereeritakse automaatselt mõne teise süsteemi poolt ja seega sisaldab ka üldist informatsiooni


Ja kui meil on näiteks Allikaks Pivot tabel, siis saame selle lahti võtta kasutades Pivot valikut. Ei pea enam kasutama üldse Tabelau Add-in'i

Visuaalne pool

Nüüd saab lisada ka drag-drop liigutustega analüütilist lisainfot - keskmine väärtus, mediaan, vahesummad jne. Ehk siis asi veelgi lihtsamaks ja kiiremaks tehtud


Lisaks saab seda kohe muuta lihtsalt peale klõpsates :)


Lisaks saab lihtsalt klõpsates objektil(objektidel) ja näha valitud analüütilist lisainfot (antud juhul Maasika ja Õuna keskmist) ja võrrelda infot omavahel (antud juhul võrrelda seda üldise keskmisega).


Saab nüüd otse teha arvutusi, ei pea enam alati tegema Calculated field'i, vaid võib otse kirjutada valemi paneelile. Ja kõige parem see, et kui hakkad trükkima, siis pakub juba sulle vastavaid funktsioone ehk sa ei pea kästisi oma valemit kirjuta


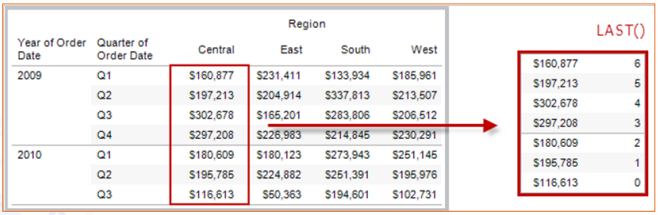
Ja nüüd kõige parem - arvutuste detailsust saab nüüd ise määrata.


{fixed [Maakond]: Sum([Kogus])}
Arvutab koguse summa maakonna kohta, mis iganes teised dimensioonid vaates pole

 Lisaks veel sellised võimalused:

{include [Maakond]: Sum([Kogus])}
Arvutab koguse summa maakonna kohta selle detailsusega, mis andmed vaates on aga võtab arvesse ka Maakonna objekti, isegi siis kui teda pole üldse vaates kasutatud

{exclude [Maakond]: Sum([Kogus])}
Arvutab koguse summa maakonna kohta selle detailsusega, mis andmed vaates on aga ei võta arvesse  Maakonna objekti, isegi siis kui ta on vaates kasutatud

Uued stringi funktsioonid

REGEX_EXTRACT(string, pattern) REGEX_EXTRACT_NTH(string, pattern, index)
REGEX_MATCH(string, pattern) REGEX_REPLACE(string, pattern, replacement)  - väga kasulikud tavalisest tekstist mingi osa leidmisel

Kaardid

 Saab nüüd ka otsida erinevaid asukohti


Ja olemas uued erinevad ala välja valimise võimalused :) Yee


Jätkub...


.

Today I love ...

When I first saw Tableau after 7 years of using SAP BO, then I really was overexcited of how wonderful Tableau is. Now when having more real life experience and passed Tableau exam, I have to say that Tableau has its own areas, which are not so wonderful. Tableau is not for heavy tables, yes you can manage, but this is not as easy

But today I love Tableau. Why?

Embedded Dashboards

As I am not a programmer I am an analyst and I love to accomplish quickly, then I love the fact, that when I want to put my Dashboard on website using Javascript API, then I can do it and I can do it by 2-3 hours. And I did it for the first time!  I wonder what you could do in days weeks?

Link (just simple example)

An the other thing - performance. Yes creating reports, analysis, dashboards you know that some day You will be asking yourself, why is it slow? Why it couldn't be quicker?

Report performance

In Tableau I have built in performance recording :) Yee. And the result is Tableau workbook, so I don't have to learn some new tool, but use already skills I have. I see exactly what step takes how long...Love this.... And I can takes steps to improve my report performance


Today I love Tableau


Tableau: Find Sum min and total min min

My aim is to find

1) distinct  min values
2) then summarize
3) then find for total rows overall min

And the thing is ShopDetail and ItemID I don't want to show to users


Lets look my example data

1) distinct  min values

To get minimum is simple - just MIN([Value]) and they are distinct by first 4 columns


2) then summarize 

To get summarized minimum I use - WINDOW_SUM (MIN([Value])) and compute using ShopDetail 


Then I need to take my table to form I need, so I add ShopDetail to Detail pill as I cannot remove it totaaly - then I could not use compute using correctly. Otherwise Tableau will not understand that I want to calculate min by ShopDetail. 

After doing this my table looks like. There are three times 106 106 106 because we have 3 ShopDetail values in there background


Now I use FIRST() function

IF FIRST() == 0 THEN

    WINDOW_SUM(MIN([Value]))

END

And now I have more real view


To make it even more beautiful you could choose Analysis->Stack Marks -> Off

3) then find for total rows overall min

For determining if row is total or not I use formula 
WINDOW_MAX(max([Customer]))=WINDOW_MIN(min([Customer]))
When I have total row then min and max don't  equal

So my final table calculation looks like

IF WINDOW_MAX(max([Customer]))=WINDOW_MIN(min([Customer])) then

(IF FIRST() == 0 THEN

    WINDOW_SUM(MIN([Value]))

END) else (IF FIRST() == 0 THEN

    WINDOW_MIN(MIN([Value]))

END) end


The only problem is that when you have data where you have only one customer row like Area North has, then the total will not be correct.


Tableau table calculations

Background

Table calculations depend upon the data  in the view, not the underlying data. Tableau Quick 
Calculations occur as a post-database processing step. 

When we select a table calc, Tableau first queries our data source (whether that be a database connection, extract, or spreadsheet). The query then returns the data for the table calc in a temporary table stored in cache. Tableau can then reference this temporary table when it needs to

We use ADVANCED mode for table calculations in 99% cases, because then when table layout is changed values are still correct

Example: In first picture compute using: Table (Down), but when we change table layout, then we will get wrong numbers, we need Table(Across) computing along


Addressing  vs. Partitioning

Functions will return different values depending on how the  calculation is addressed and partitioned

Partitioning: the scope or grouping of the calculation. Defines how to group calculation.  Simply instructs Tableau to repeat  the calculation
Addressing:  Defines what part the  table calculation is computing along. Are fundamental to the calculation


Helper functions

Certain table calculation functions provide information about the  relative position of an item within a partition. These can be used  in a view or more commonly they are used as part of other  calculations. 

First( )

Returns the number of rows from the current row to the first row  in the partition. For example, the view below shows quarterly  sales. When FIRST() is computed within the Date partition, the  offset of the first row from the second row is -1.


Last( )

Returns the number of rows from the current row to the last row in  the partition. For example, the table below shows quarterly sales.  When LAST() is computed within the Date partition, the offset of 
the last row from the second row is 5


Index( )

Returns the index of the current row in the partition. The first row  index starts at 1. For example, the table below shows quarterly  sales. When INDEX() is computed within teh Date partition, the  index of each row is 1, 2, 3, 4...etc.


Size()

Returns the number of rows in the partition. For example, the view  below shows quarterly sales. Within the Date partition, there are  seven rows so the Size() of the Date partition is 7


Primary functions

LOOKUP(expression, [offset])

Returns the value of the given expression in a target row,  specified as a relative offset from the current row. Use FIRST() + n and LAST() - n for a target relative to the first/last rows in the
partition. If offset is omitted, the Compare To row may be set on  the field menu. Returns NULL if the target row cannot be  determined.

For example, the view below shows quarterly sales. When  LOOKUP (SUM(Sales), 2) is computed within the Date partition, each row will show the sales value from 2 quarters in the future


PREVIOUS_VALUE(expression)

Returns the value of this calculation in the previous row. Returns  the given expression if the current row is the first row of the  partition. Example: SUM([Profit]) * PREVIOUS_VALUE(1) = running product of  SUM(Profit)

RUNNING (Avg, Count, Max, Min, sum)

EX: RUNNING_AVG(expression). Returns the running average of the given expression, from the first  row in the partition to the current row. For example, the view below shows quarterly sales. When  RUNNING_AVG(SUM([Sales]) is computed within the Date  partition, the result is a running average of the sales values for  each quarter.


Tableau geospatial analysis (Esri, Maaamet WMS etc)

After reading this news "SAP recently announced a partnership with Geo-Analytics provider Esri in hopes of enhancing spatial data analysis across multiple software products.Lumira already has spatial data mapping capabilities, so what makes Esri different? It’s about having more predefined visualizations available in the SAP library", I wondered how about Tableau?


Tableau mapping


With Tableau you can create filled, symbol, pie or what ever chart you want. Also you can  combine these charts how ever you like and change background layers - add different borders, names, water/no water etc. And you can zoom to very detail level (16x zoom)


Or show different paths on map


Tableau mapping (Estonia)


With Tableau you can create Estonian maps easily and even change your source data, when for example some districts are misspelled

Country=Estonia
State/Province=Maakond, Names like Harju, Lääne etc.
City=Tallinn, Tartu etc.


Tableau Custom Geomapping


You can add more smaller Cities or what ever you want if you like, just use custom geomapping


Or you can create totally new hierarchies (For Example Add RMK resthouses etc), just  you have to have Longitude and Latitude fail

Or create your own areas for example from ESRI shapes. For example show data by http://geoportaal.maaamet.ee/est/Andmed-ja-kaardid/Haldus-ja-asustusjaotus-p119.html
official borders: Maakond, Omavalitsus,Asutusüksus


Tableau and Maamet WMS service


As Tableau supports WMS (Web Map Service) services, there is  also opportunity to use WMS service http://kaart.maaamet.ee/wms/alus-geo?

Just add link and say on your visualization, that you want to use this map

Tableau allows connections to all WMS providers that support WMS 1.1.1 standard and EPSG:4326 geographic projections


And you can use many different layers from this service


Tableau and Esri

What is Esri?
Esri is a GIS mapping software provider that allows users to visualize data geographically.

You can also use Esri maps and with ease


Eestis tehtud Google'i otsingud (EST)

Proovides veidi värvidega mängida ja leida andmetes seoseid vabal ajal :)
Väikese interaktiivsusega, kuna Google Trend keskkonnast tasuta andmete kätte saamine on piiratud - andmed on normaliseeritud ja mitte sidusad. Kuna tegemist  Tableau uue beta mitte veel ametliku versiooni peal tehtud näitega, siis võib esineda erroreid, kuna server veel ametlikul kehtival versioonil


Comparison of Business Intelligence and Analytics Platforms

Comparison of Business Intelligence and Analytics Platforms  (the information is taken from Gartner report 02.2014 ) and put together as good as I