1 Installation and configuration
Installation is easyGetting started
BIRT Designer Pro looks and functions the same as BIRT Designer. You can use also open BIRT Designer files in Professional. But Vice verse - there were errors, themes missing etc2 Data Connections
Connection making, data sets etc is the same

2.6 Complex data model (loops, shortcut joins, multi fact- multipass SQL) and calculations (see your query)
All the same. In professional you have also Union capability - union different data sets not just blending
It seems that from database it by default queries all data - the data set query. When you filter data in view mode, then you can filter data by all data that is in data set, no query is made to database
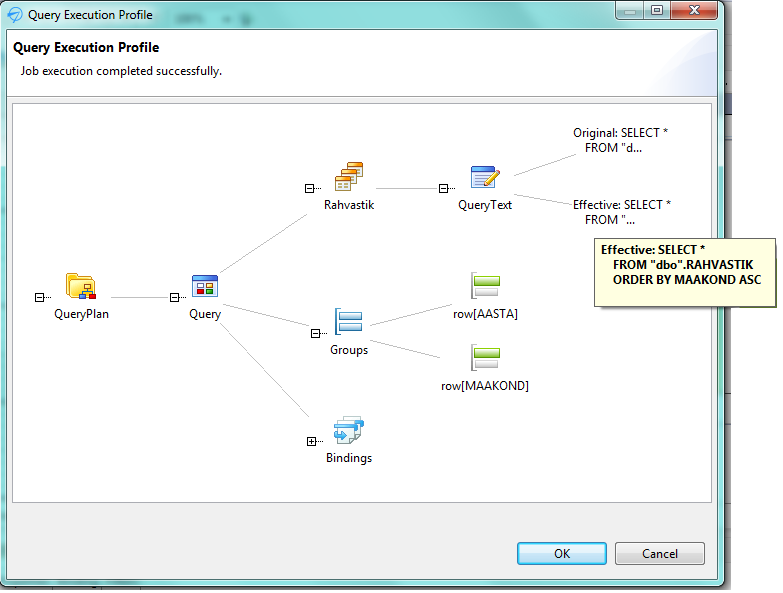
See your query - > You can see query execution profile for every element
In Pro there is for creating dashboards Data Object (consists of data source, data set and data model, shared dimensions) functionality.
Building a data object entails creating a data object file, then adding data sources, data sets, data models, and cubes to the data object. To add these data items, you can:
*Create new data items within the data object.
*Export data items in reports or libraries to the data object.
Once you create a data object, a data source, and data sets, you can use the data sets to build a data model. Using a data model as a data source is preferable to using a data cube or an information object for the following reasons:
*Data model queries are optimized and therefore offer better performance.
*When creating crosstab reports, a data model offers more flexibility in the choice of dimensions and measures.
Typically, a data model consists of several data sets linked by joins.
In Actuate BIRT (commercial) there is way to dynamically change queries based on content of charts and/or tables.
When you create each table as data set and join them in data model, then it queries database only the fields it needs (but no group by ). But join culling does not work. When you use disable bush down, then join is made in BIRT
If you use a JDBC Database Connection for Query Builder data source, in many cases, joins in a data model are pushed down to the database. If either of the following statements is true, disabling join push-down may improve query performance:
*The join columns are not indexed in the underlying database.
*Query performance is unacceptable.
In data model you can create only inner joins.
You define joins between data sets in a data model in the same way that you define joins between tables in a SQL query

When you have different data sets, then it detects loops and you have to remove one join to remove loop. You can create aliases.

3 Functionality
3.2 Drilling
When using data cubes, then you can drill up/down on chart on report
You cannot drill on the table, but you have to open analyze. When in there you drill and end analyzing and save ok - then in report you see this down drill values like HIIU >Mehed/Naised

3.6 Geospatial analysis
You cannot drill on the table, but you have to open analyze. When in there you drill and end analyzing and save ok - then in report you see this down drill values like HIIU >Mehed/Naised
You can create simple map. You can map locations

4 Visualizations
4.1 Visualizations
There are quite many opportunities and although the visual side is quite attractive.You can also add gadgets

When you view your report, it is quite nice, now you can use enable interactivity. The end user can change chart type (simple), filter, top/bottom N


4.2 Dashboards
Dashboard you can make through web browser. You can add filters, that apply to all visuals. It is quite good and looks good. But looks slow, crashed for me.SQL in the background is not only by data set but is created dynamically. But the problem is that it selects relevant fields but no group by or sum is used. And when you filter then also query is made in database
You can select area and zoom
Drilling on charts works (it seemed, that when i changed drill hierarchy on Designer and then wanted to see change id dashboard - i didn't see this, i had to make new dashboard , but maybe i didn't know how)

6 Server BIRT iHUB
http://www.actuate.com/download/brochures-datasheets/BIRT-iHub-DataSheet.pdf
Server side is simple but visualizations look good (slow in my computer)
Server side is simple but visualizations look good (slow in my computer)
You can schedule and edit etc report


Simple version

Advanced version

Row based security
"1) Page level security - Actuate iServer express V10 offers Page Level Security, a unique and powerful capability that generates a single document, which includes security rules that determine which pages a user can see, print or save. Page Level Security allows a single piece of content to be generated and deployed that addresses the secure information distribution needs of many users. PLS reduces the load on the underlying data source by invoking a single query. PLS reduces the number of report instances to one. And, because a single document is generated, PLS eliminates the management necessity to secure individual access locations.
2) Row level security - BIRT reports deployed via Actuate iServer express V10 can leverage enhanced data access functionality whereby at execution time, the engine will automatically pass user specific credentials in the filter clause of the report query. Thus the data available for the report will be automatically filtered based on the user.
3) Report parameters - Developers can also design reports with specific parameters whose values are then passed along in the WHERE clause of the report query. This ensures that the dataset available for the report is automatically filtered based on who the user is and what he/she is trying to do."
6.1 Deploy Report
Yes you can save report to server. You can create reports/dashboards in server also6.2 Personalized scheduling (report Bursting)
You can schedule reportsSimple version
Advanced version
"1) Page level security - Actuate iServer express V10 offers Page Level Security, a unique and powerful capability that generates a single document, which includes security rules that determine which pages a user can see, print or save. Page Level Security allows a single piece of content to be generated and deployed that addresses the secure information distribution needs of many users. PLS reduces the load on the underlying data source by invoking a single query. PLS reduces the number of report instances to one. And, because a single document is generated, PLS eliminates the management necessity to secure individual access locations.
2) Row level security - BIRT reports deployed via Actuate iServer express V10 can leverage enhanced data access functionality whereby at execution time, the engine will automatically pass user specific credentials in the filter clause of the report query. Thus the data available for the report will be automatically filtered based on the user.
3) Report parameters - Developers can also design reports with specific parameters whose values are then passed along in the WHERE clause of the report query. This ensures that the dataset available for the report is automatically filtered based on who the user is and what he/she is trying to do."
6.3 Metadata repo reading
No metadata layer
7 Ease of use
The result is more beautiful, but to get things done, is the same as in free version. Yes you have more opportunities like maps and dashboards - dashboard is like Tableau, but with less functionality
8 Performance
Professional was quicker (visualization rendering especially) then the free version. Using 128 000 rows, it was quite quick, which was surprising
Data containing 14 milj rows - BIRT couldn't read it - just hang
Data containing 14 milj rows - BIRT couldn't read it - just hang
9 BIRT Analytics
Looks like more for analyzing, mining not for so much presenting. Capabilites - trend, forecast, bands etc.