PENTAHO REPORT DESIGNER
Trying open source Pentaho Report Designer
1 Installation and configuration
Installation was easy, just need to have Java.
Getting started
The interface looks logical. Create new report and start with adding data source
2 Data Connections
2.1 Supported data sources
There are many opportunities
And also JDBC connection (you have to add driver for lib/jdbc folder), so that JDBC connection works
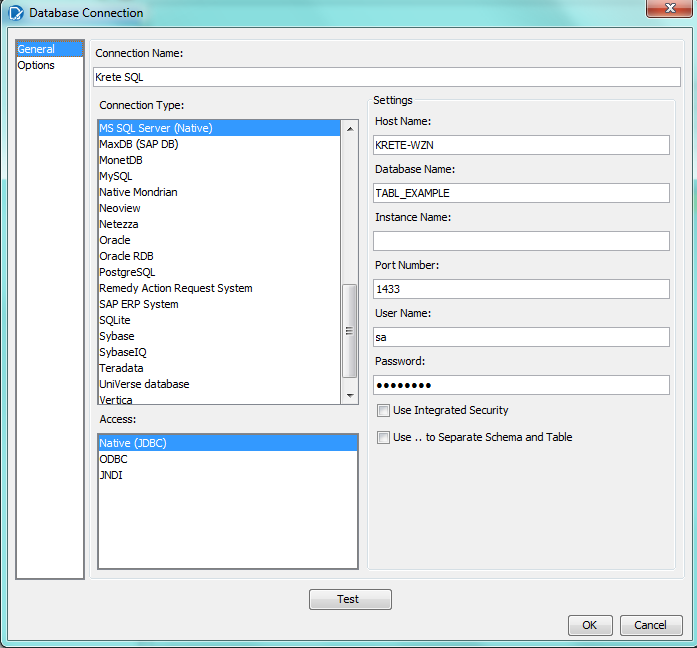
2.2 Creating a data connection
Creating data connection is easy, look previous picture
Then you can create data sets - query.
There is also a simple Query Designer graphical interface (join can not be edited). You can rename attributes
2.3 Connection re-usability
It doesn't seem, that I could use data sets defined before
In blog I found " Styles, data sources, queries, parameters and parameter groups can be saved and loaded when designing a report."
http://www.innoventsolutions.com/comparison-matrix.html
2.5 Mergeing/blending
Cannot join multiple data sources.
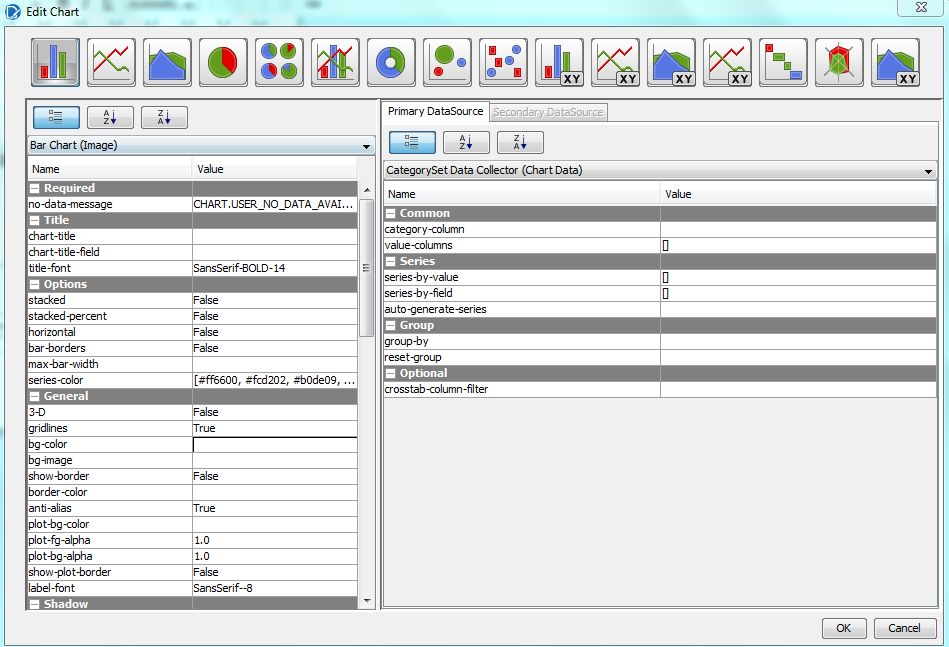
Only in chart (bars and line) - you can use secondary data source
2.6 Complex data model (loops, shortcut joins, multi fact- multipass SQL) and calculations (see your query)
There doesn't seem to be any intelligence background query engine. The query that is made for data set is used. If you want to group data on report, then to get it work, you have to order data the same way
You can add calculations, for example running sum (the summing is made in Pentaho)
But calculations work quite good, you can define also partitioning
3 Functionality
3.1 Parameters
You can add parameters
You have to create your own distinct query to retrieve unic values for creating parameter and then add condition to main query.
3.2 Drilling
There is no simple drilling functionality, you can use HTML or XML to accomplish something like drilling.
"Use anchors to build internal link targets in your detailed report. Use the HTML anchor style to construct a unique, but predictable, identifier for your link target. Use a formula on that style for that, something like
To get a summary of your data, add a subreport to the report-header. Inside the subreport, add the links to your anchors of your main-report."
"Usually for interactive drilling, especially when working against a data-warehouse, we recommend Analyzer (or Saiku, when you are strictly on the community edition).
These tools dont try to be pixel perfect and optimized for printing, they are optimized for interactivity and quick response times. And they do drill down quickly and efficiently"
One opportunity is to use Mondrian cubes with JPivot (but this is not done in Designer - it's in Server)...
3.3 Drilling through reports
Yes, exists and you can do it through formula.
=DRILLDOWN("local-prpt"; NA(); {"oStatus"; ["chart::category-key"] | "showParameters"; [STATUS] | "solution"; "steel-wheels" | "path"; "reports" | "name"; "Order Status.prpt"})
3.4 Quick Filters (drop-down, search)
There is no quick filters
3.6 Geospatial analysis (wms)
There seems no easy way to do it in free edition
"We use a series of Pentaho action sequences, which are instructions to Pentaho's solution engine, to retrieve the western region customer and customer address information. We then use Google's GClientGeocoder class to change our address information into latitude and longitude coordinates. These coordinates are passed to the Google Maps API when the browser's onload() event is fired, and the coordinates are plotted as points on the map."
4 Visualizations
4.1 Visualizations
4.2 Complex calculations
You can your own fields (predefined), but there is not very wide selection. You can write java, phyton, SQL etc
5 Output
5.1 Report output formats
There are all export functionalities. You have to put some attention on report pixel design so that in Excel there wouldn't be so many empty rows.
6 Server (BI server)
The web side looks nice. There is folder hierarchy, favourites, recents

6.1 Deploy Report
Quite simple, you choose server and folder. It seems (also info from blogs) that you have to have the same data source defined in server to view your report on server.

6.2 Query Logging
You can configure separate log file for SQL
http://bi-thoughts.com/2011/02/15/pentaho-enabling-sql-logging/
6.3 Scheduling
Scheduling works, but the thing is, that it creates separate file work every schedule
6.4 Personalized scheduling (report Bursting)
It is doable somehow, didn't find any simple tutorial how to do it in current version. It seems that you have to have Design Studio to do this and to create Action Sequences.
"Design Studio is Eclipse based Application and plug-in used to create Action Sequences"
"Activities that the Pentaho BI Platform performs are defined by Action Sequence XML documents. Action Sequences define activities such as database queries, report generation, email actions and the order in which they occur. Data can be passed between Actions within an Action Sequence or between executions of other Action Sequences. They define the inputs that must be available prior to execution, the processes that will be performed and the outputs that will be available to other Action Sequences after execution is complete."
"You can use business rules, database queries, web service calls, scripting, and workflows to customize the system as much as you need.
Since the Burst Rule and the Burst Process are separate processes Burst Rule could be implemented in any custom application and messaging, web services, or workflow orchestration used to initiate each Burst Process.
Pentaho supports Report bursting by providing abilities in Data Integration tool and Design studio."'
"Business rules can be used to determine the recipient(s) for any report or parameterized report. Pentaho includes several business rules engines for flexibility"
"Your issue is pretty similar to ours. We had ACCOUNT_NUMBER_1 -> userA, userB. ACCOUNT_NUMBER_2 -> userC, userD ...
You're going to have to get really creative about how you want to go about this without implementing your own JDBC authentication plugin for the BI server. One thing that we did was create a table on the database that mapped ACCOUNT_NUMBER to Pentaho Roles. Based on what role the user was in, dictated which ACCOUNT_NUMBER showed in the drop downs. Additionally, we set folders up using those roles.
However, that leads to a lot of role explosions. In short the only "clean" way of doing what you want is to come up with your own means of authenticating users or come up with some sort of clever work around. Pentaho's security system is a very basic, lowest common denominator one. However, that's pretty much comes with any BI platform as the goal is to hit the lowest hanging fruit first."
6.5 Security
Not very advanced one
6. 6 Embedded reporting
Pentaho Reporting includes report navigation and report viewer components that can be integrated into portals or web pages. We also include JSR-168 compatible portlets and example Java Server Pages (JSPs) that use these components.
6. 6 Other
You can use Community Dashaboard Editor and Framework to create dashbaords in opern source version, but it is just not so simple as in enterprise version. Also you can use plug in's and JPivot for drilling
7 Ease of use
In conclusion, Pentaho seems a little bit simpler than BIRT and free edition looks quite nice, but is seems that it lacks from many aspects (no blending, interactivity, less options in chart making, no simple crosstab functionality built in, for grouping, sorting you have to change query etc)
http://www.innoventsolutions.com/comparison-matrix.html
8 Performance
with 125 000 rows, it was ok, with 14 miljon rows, it took a lot of time
9 Pricing and products
9.1 Business Analytics- BI server
Pentaho's modern, simplified, and interactive approach empowers business users to access, discover and blend any data types regardless of their size. With a full spectrum of increasingly advanced analytics tools, from basic reports to predictive modeling, users can help themselves to analyze and visualize data across multiple measures and dimensions without being dependent on IT.
9.2 Data Integrator
Pentaho’s Data Integration, also known as Kettle, delivers powerful extraction, transformation, and loading (ETL) capabilities. You can use this stand-alone application to visually design transforms and jobs that extract your existing data and make it available for easy reporting and analysis.
9.3 Report Designer
The Report Designer is a graphical tool that generates reports from data streamed through the Data Integration engine without the need for any intermediate staging tables. You can output your reports in several formats, including PDF, Excel, HTML, rich-text-file, XML. and CSV
9.4 Aggregation Designer
The Aggregation Designer provides a simple interface that allows you to create and deploy aggregate tables to improve the performance of your Pentaho Analysis (Mondrian) OLAP cubes.
9.5 Schema Workbench
You can create OLAP cubes
The Schema Workbench is a visual design interface that allows you to create and test Mondrian OLAP cube schemas. You can present your data multi-dimensionally and let users select which dimensions and measures to explore, interactively drilling into cross-tabulating data.
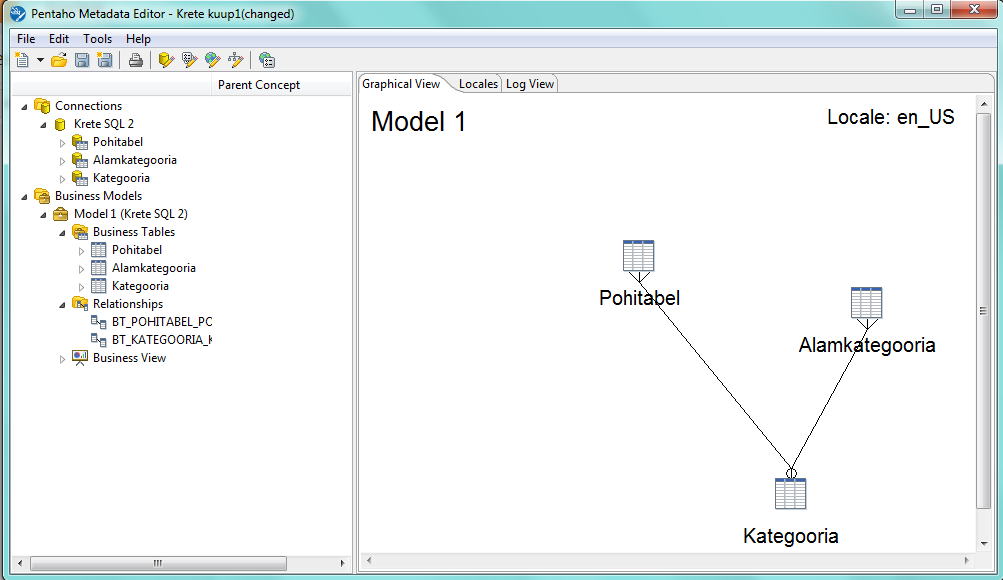
9.6 Metadata Editor
Metadata Editor is a tool that simplifies your experience when creating reports, and allows you to build metadata domains and relational data models.
Tried, looks simple, you can create logical model on physical tables, different business views, add descriptions and you can add custom attributes, default aggregations, different languages
Then you can use view you made in Metadata Editor in Report Designer.
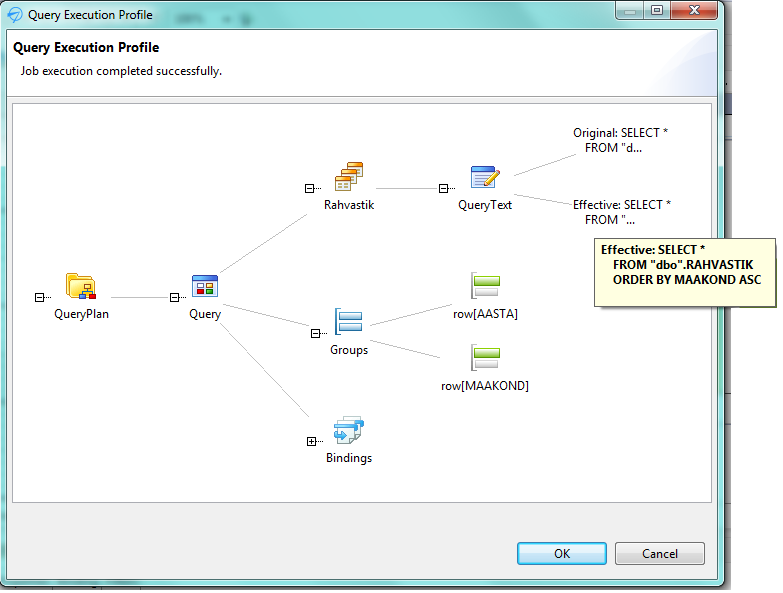
You choose connection Metadata and add query
In here you can also use graphical view, you select your models and columns. In this way the query that is executed is group by, order by in the database already